Case Study 02 · Midway Financeira · 2023 to 2025

Design System and
Governance at Scale

Organizational infrastructure for delivery at scale across two brands. A unified Design System serving two brands, 11 designers, and 15 squads positioned not as a visual toolkit, but as organizational capital that reduced marginal delivery cost and made execution at scale structurally predictable.

Company Midway Financeira + Riachuelo · Grupo Riachuelo
My Role UX Manager ownership of system architecture, governance model, adoption across both brands, and executive interface with Tech, Product and the Director of Financial Products.
Operating Scale 11 designers across 15 products · 7 channels · financial and retail ecosystem operating across App Midway, App Riachuelo, Ecommerce and PDV, Web, WhatsApp, and Backoffice
Period 2023 to 2025
Disciplines
Design Systems Org Design Governance Token Architecture Component to Code AI Integration Change Management
Outcome Annualized efficiency impact in the seven figure range (masked) · +30% delivery capacity · up to 50% code time reduction · CSAT above 4.7
11
designers · 15 squads
+30%
delivery capacity
−50%
code time · first journeys
7fig
annualized efficiency impact
Design SystemShared Brand InfrastructureComponent to CodeGovernance15 SquadsAI Integration2 Brands Design SystemShared Brand InfrastructureComponent to CodeGovernance15 SquadsAI Integration2 Brands
Executive Summary

A fragmented design operation
is a balance sheet liability.

The initiative operated across 11 designers and 15 squads, serving a financial and retail ecosystem spanning App, Store and PDV, Web, WhatsApp, and Backoffice. Neither Midway nor Riachuelo had unified design infrastructure. Each squad maintained its own component library. Design and engineering operated from different sources of truth. Inconsistency accumulated at every delivery cycle as rework, misalignment, and lost time to market.

The Design System was the structural response to an organizational risk not a craft investment. Its return was measured in headcount equivalent, delivery throughput, and code time reduction. Built, governed, and adopted as infrastructure not tooling.

Key Indicators

+30%
Delivery capacity
−50%
Code time · first journeys
100%
Task success · priority card journeys
7fig
Annualized efficiency impact (masked)
02 Organizational Problem

The problem was
not aesthetic.
It was systemic.

Fragmentation at the component level is a symptom of a deeper organizational failure: design and engineering operating as parallel systems rather than an integrated function. At Midway and Riachuelo, this manifested across every dimension of delivery with compounding cost at each layer.

Duplicated components
Each squad maintained its own component library. The same button, input, or card existed in multiple versions across 15 squads, each requiring separate maintenance and diverging further over time.
Design and Tech misalignment
Design and engineering worked from different sources of truth. Every handoff carried translation cost. Developers rebuilt components already designed. Rework was structural, not accidental.
No governance mechanism
No formal process governed what entered the system, who owned what, or how standards were enforced. Quality varied with personnel, sprint pressure, and squad culture.
Isolation between brands
Midway (fintech) and Riachuelo (retail) operated as entirely separate design environments despite sharing infrastructure, engineering teams, and organizational leadership. Investment in one brand was invisible to the other.
Discovery to delivery friction
Without shared standards, the delivery pipeline extended unnecessarily. Design time was consumed rebuilding rather than creating. Engineering time was consumed aligning rather than shipping. The bottleneck was infrastructure, not capacity.
03 Economic Risk

Fragmentation has
a price tag.

The case for a Design System is economic, not aesthetic. Fragmented infrastructure generates costs that accumulate invisibly across every sprint: rework, misalignment, delayed time to market, and the human capital required to compensate for systemic inefficiency.

"Every component rebuilt is a cost that does not appear on any invoice. It compounds across 15 squads, every two weeks, across multiple years."

Economic framing · Design System · 2023

These costs do not plateau. As squad count grows and channel surface expands, fragmented infrastructure becomes progressively more expensive to maintain. The Design System was not an investment in quality. It was a risk mitigation decision.

Risk Register
Time to Market

Elevated delivery cycles driven by component rebuilding and design and engineering realignment on every sprint. Competitive window shrinking with each avoidable delay.

Headcount Pressure

Organizations compensate for systemic inefficiency by adding headcount. Without shared infrastructure, growth required proportional team expansion an avoidable capital allocation.

Code Redundancy

Redundant code bases across channels increased maintenance burden, elevated regression risk, and created technical surface without proportional value.

Experience Inconsistency

Inconsistent interfaces across channels elevated contact rate. Users encountering different patterns across the same product generated avoidable support volume and eroded confidence.

04 Strategic Decision

UX stopped responding
to isolated demands
and started organizing the system.

The strategic decision was a reframing of the function's mandate. Rather than managing a backlog of component requests, I structured a formal internal RFP process, establishing the Design System as an organizational initiative with executive sponsorship, shared ownership across product, engineering and design, and a measurable business case. This shifted governance from reactive to architectural.

A
Internal RFP

Business case built before the first component

Formalized the investment case with estimated saving, capacity gain, and risk reduction modeled before any design work began. Secured executive sponsorship from the Director of Financial Products by framing the system as a capital efficiency decision not a craft initiative.

B
Shared Brand Foundation

Midway and Riachuelo operating from a single design infrastructure
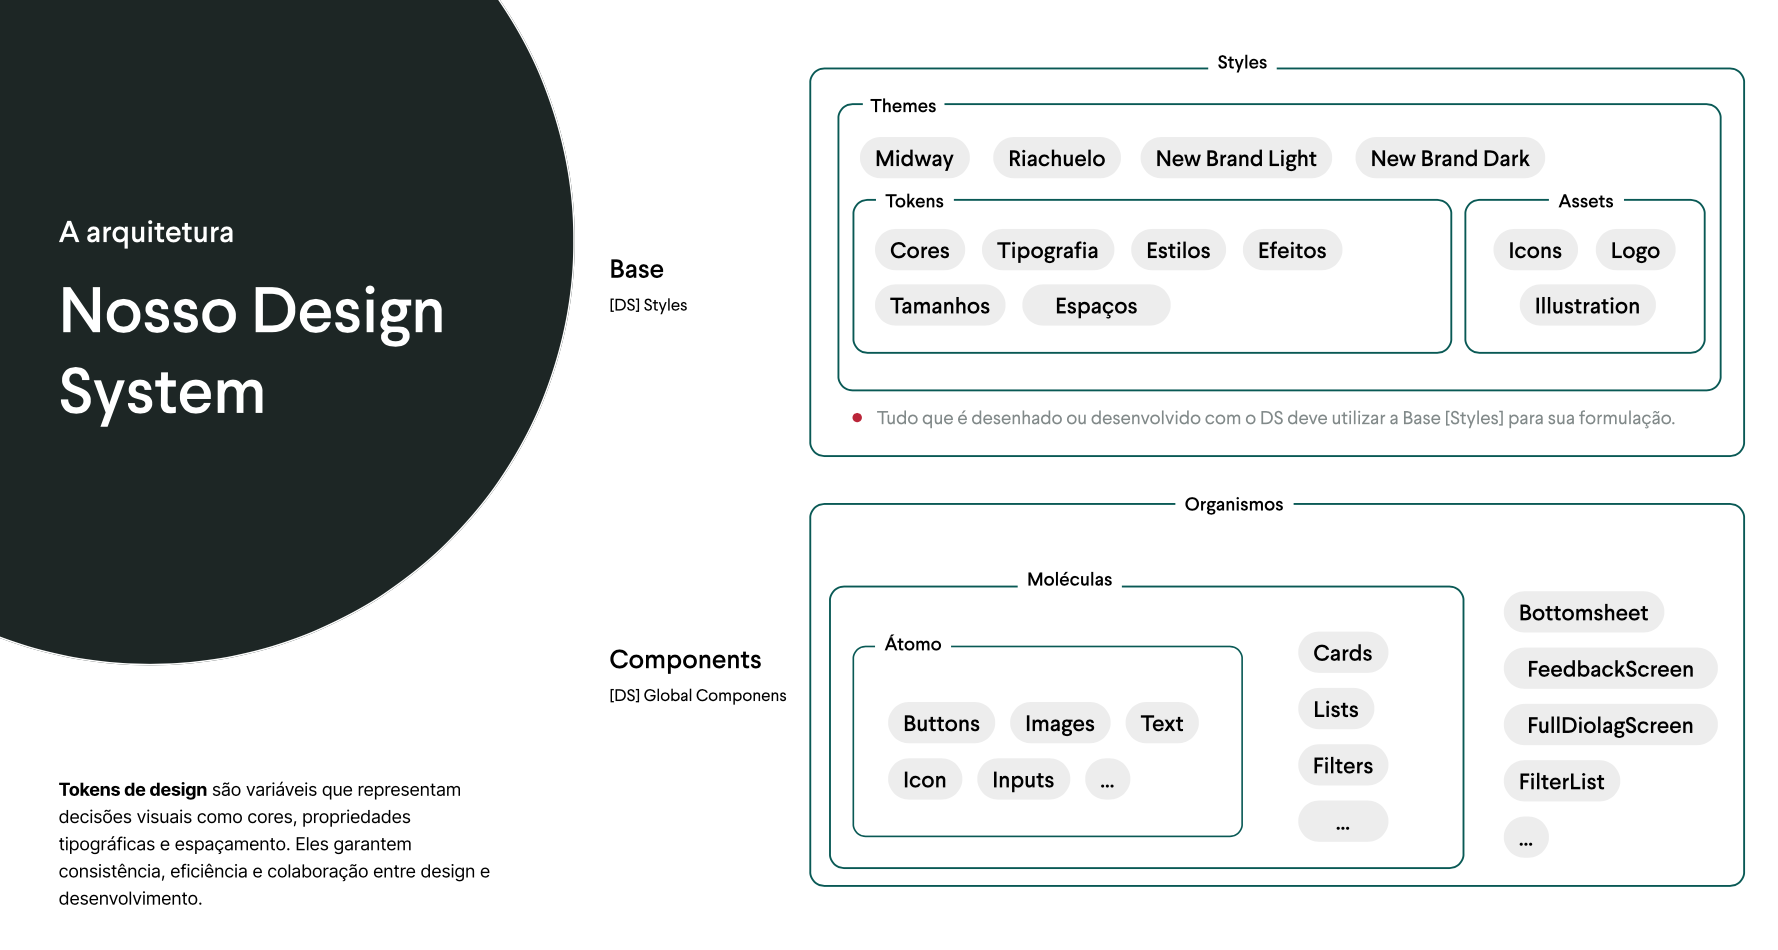
Structured the system to serve both the fintech and retail brands from a shared foundation. Token architecture enabled brand differentiation at the surface while the structural layer remained unified. One system, two expressions.

C
Formal Governance

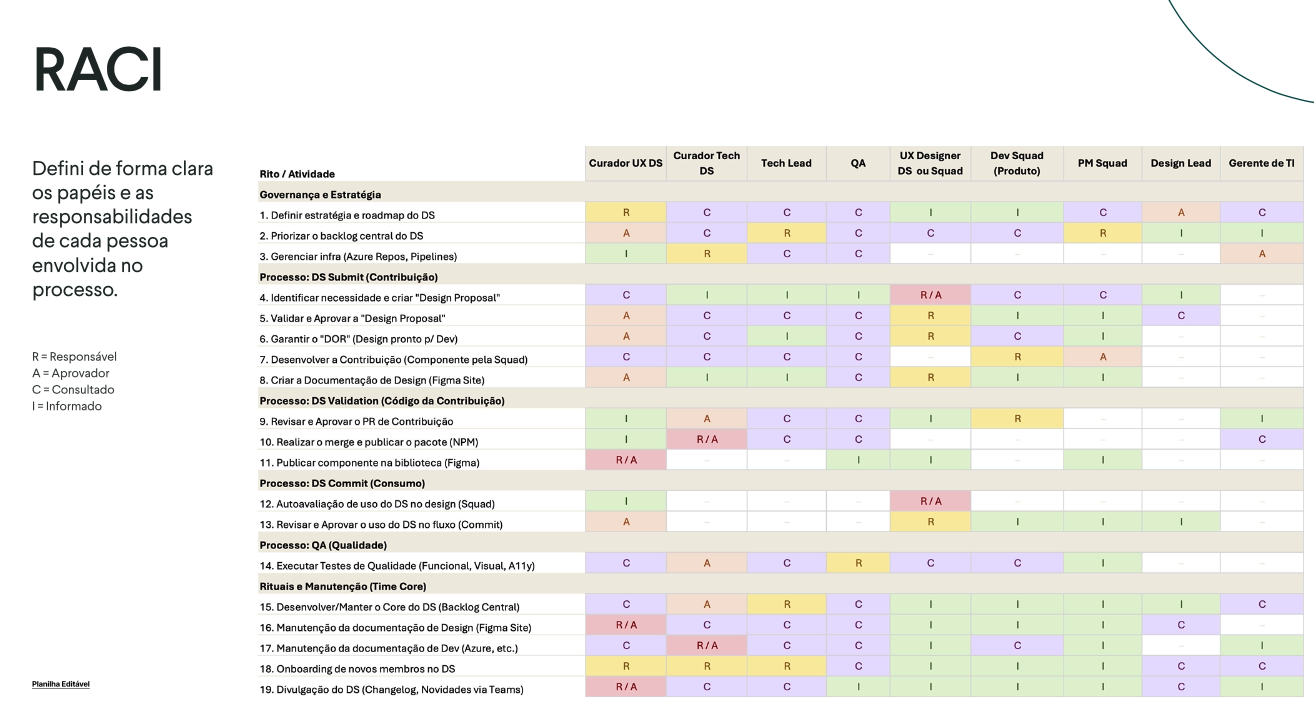
DS Committee, RACI, and mandatory adoption threshold

Established a weekly Design System committee with representation from design, engineering, and product. Created formal RACI documentation. Set mandatory adoption metrics per squad tracked on the public roadmap. Governance was institutionalized, not negotiated sprint by sprint.

05 Architecture Built

Four layers.
One integrated system.

The Design System was not a Figma library. It was a four-layer organizational infrastructure connecting design decisions to engineering output, governed by formal process, and measured by economic outcome. Each layer was sequenced with the adoption curve in mind: foundation first, then code integration, then governance, then scale.

Layer 01
Design Foundation
Figma · Tokens
Token Architecture
Primitive, semantic, and component token hierarchy enabling brand differentiation at the surface while the structural layer remained shared across Midway and Riachuelo. One change at the primitive level propagates across both brands simultaneously.
Figma Library
Centralized, versioned component library with formal documentation, usage rules, and mandatory variant standards. Eliminated the 15-squad fragmentation by establishing a single source of design truth with governed access and contribution protocol.
Documentation Standard
Every component documented with usage rules, antipatterns, accessibility requirements, and brand variant mapping. Documentation was treated as a product deliverable, not optional annotation.
Shared Brand Expression
Token layer enables complete brand visual differentiation color, typography, spacing, radius while sharing identical structural components. Financial product constraints around accessibility and regulatory clarity governed both brands at the baseline.
Layer 02
Code Integration
React · Storybook · AI
Component to Code via AI
Integrated Locofy AI into the DS Commit flow, enabling direct generation of React and React Native code from Figma components. This compressed the design to code cycle and eliminated a significant category of engineering rework on component implementation.
Storybook Integration
Engineering component library documented and maintained in Storybook, providing a live, interactive reference that engineers could consume without requiring designer involvement for component specification queries.
Code Repository Connection
Design System connected directly to the engineering monorepo. Component updates followed the DS Commit governance flow before entering the code library, eliminating ad hoc component creation at the squad level.
Impact on Delivery
First DS native journeys demonstrated up to 50% reduction in code implementation time versus the pre DS baseline, measured in engineering hours against equivalent-complexity prior period deliverables.
Layer 03
Governance
Committee · RACI · Roadmap
DS Committee
Weekly committee with representation from design, engineering, and product. Formal agenda covering contribution review, adoption tracking, conflict resolution, and roadmap prioritization. Decisions documented and distributed. Governance as a standing operational ritual, not an ad hoc escalation mechanism.
DS Commit Protocol
Formal contribution process: any addition or modification to the system required documentation, review across functions, and committee approval before entering the library. Eliminated unilateral component creation at the squad level the primary driver of pre DS fragmentation.
Public Roadmap
System roadmap visible to all squads, surfacing what was in progress, what was available, and what was planned. Reduced inbound requests for components already under development and enabled squads to plan deliveries against DS availability.
Adoption Metrics
Mandatory DS adoption threshold tracked per squad. Metric reported in the executive governance cadence. Non-compliance required documented justification, changing the default from "build locally" to "use the system."
Layer 04
Adoption Curve
Saving · Scale · CSAT
Compounding Return
DS saving is not linear. Each squad onboarded multiplies the return on the infrastructure investment. Early squads generate modest savings; at projected full adoption across 15 squads, the system generates capacity equivalent to multiple additional headcount without budget expansion.
Phased Adoption
Adoption was sequenced by product criticality and engineering readiness, with highest-traffic journeys first. Early delivery evidence sustained executive sponsorship through the full implementation arc.
Quality Signal
CSAT above 4.7 across priority journeys built on the unified system, with 100% task success on priority card journeys in moderated usability testing. These results provided the evidence base for expanding adoption beyond initial squads.
Efficiency Trajectory
At projected full adoption across 15 squads and both brands, annualized efficiency impact is estimated in the seven figure range based on headcount equivalent, rework reduction, and maintenance cost elimination.
06 Measurable Impact

Infrastructure with
measurable return.

+30%
Delivery capacity
Design time freed from component rebuilding, reallocated to higher complexity product work across the portfolio.
−50%
Code implementation time
Engineering time on DS native components versus pre DS equivalent complexity in first journeys delivered on the unified system.
>4.7
CSAT · priority journeys
Satisfaction across priority financial journeys built on the unified system, measured across usability studies post implementation.
100%
Task success · card journeys
Priority credit card journeys in moderated usability testing after DS implementation. Consistent performance across tested variants.
Multiple
Headcount equivalent capacity
Capacity generated by system efficiency equivalent to multiple additional headcount without budget expansion.
7fig
Annualized efficiency impact (masked)
Estimated at projected full adoption across both brands. Reflects engineering time equivalent, rework reduction, and maintenance cost elimination.
15
Squads on adoption roadmap
All 15 squads on a structured DS adoption curve. Efficiency compounds as each squad reaches full compliance threshold.
2
Brands · 1 system
Midway (fintech) and Riachuelo (retail) served from shared infrastructure. Token architecture enables brand independence at no additional structural cost.

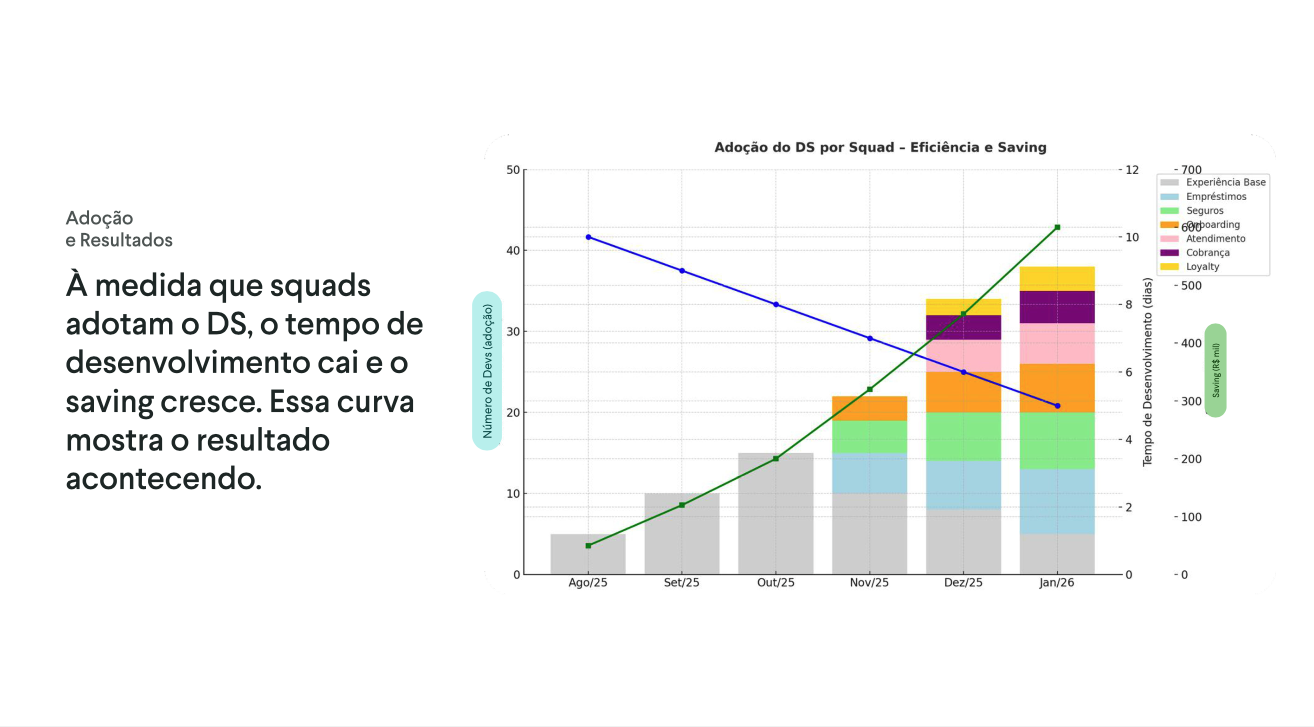
All metrics are masked and based on internal measurement models; figures reflect early adoption or projected full adoption scenarios.

07 Conflict & Leadership

Without governance,
scale is illusion.

Implementing a governance model into an organization that had operated without one generates structural resistance. The conflicts below were organizational, not interpersonal. Each required a decision that prioritized long term system health over short term convenience. Each was made explicitly and documented.

1
Conflict 01 · Product Resistance
Product teams resisting DS governance as delivery friction
The Tension

Product managers and squad leads framed DS adoption requirements as bureaucratic overhead that slowed squad velocity. The argument was consistently that "we don't have time to wait for the system," using sprint urgency as justification for continuing local component creation.

The Decision

Held the governance requirement. The counter-argument was made in economic terms: the cost of one sprint's delay to adopt a DS component is smaller than the compounding cost of maintaining a divergent component across two years and 15 squads. The adoption threshold was not negotiated down. Exceptions required documented justification reviewed by the DS Committee.

2
Conflict 02 · Centralization vs. Federation
Transitioning from central control to federated governance
The Tension

Early DS governance was centralized by necessity: standards were new, adoption was partial, and quality variance was high. As the system matured, squads expected greater autonomy. The transition created a governance ambiguity window that individual squads attempted to exploit by reintroducing local standards.

The Decision

Designed the federated model explicitly rather than allowing it to emerge by default. Contribution rights were earned through demonstrated adoption compliance. Squads with consistent DS adherence gained contribution privileges; those with variance remained in a governed consumption model. Federation was a capability status, not a default entitlement.

3
Conflict 03 · Scope Defense
Refused to assign DS designers to product management responsibilities
The Tension

As the DS function grew in organizational visibility, pressure emerged to assign DS designers to product management responsibilities within the squads they served: backlog ownership, stakeholder management, sprint facilitation. The rationale was context. The effect was designers performing dual roles at reduced quality in both.

The Decision

Formally declined and documented the boundary in RACI. DS designers were responsible for system quality, contribution governance, and squad enablement not product ownership. The boundary was enforced as a capacity protection decision with direct impact on DS delivery quality. Clarity of role enabled higher output in both functions.

08 Cultural Shift

From urgency culture
to predictable system.

The most durable outcome of the Design System was not the component library. It was the organizational behavior change it enforced. A system with governance produces a different decision culture than one without.

Before DS
After DS
Organizational Effect
Urgency as the default justification for bypassing standards
Urgency assessed against system cost; exceptions require documented rationale
Standard as default. Exception as exception.
Each squad solving the same problem independently
Shared problems solved once at the system level, consumed by all squads
Multiplied return on design investment
Design and engineering alignment negotiated per sprint
Alignment established at the system level; squads consume, not negotiate
Predictable handoff. Reduced rework.
Quality variance across channels driven by squad culture
Quality floor established by the system; variance reduced structurally
Consistent experience across all channels
Fragmented execution producing unpredictable delivery timelines
Governed system enabling delivery forecasting and capacity planning
Predictability as organizational capability
DS investment framed as a design tool cost
DS investment measured as headcount equivalent and operating cost reduction
Design as balance sheet asset
09 2026 Vision

UX as infrastructure
for growth.

The Design System built at Midway is a foundation, not a destination. The 2026 trajectory connects infrastructure maturity to the next phase of organizational growth.

HORIZON · 01

Execution with AI Integration

The component to code integration via AI represents the first layer of an AI augmented delivery model. At full maturity, the Design System becomes the constraint layer for AI assisted design and engineering, compressing delivery cycles further without proportional headcount increase. The infrastructure built today is the precondition for AI leverage tomorrow.

HORIZON · 02

Full Federated Adoption

Full adoption across all 15 squads and both brands unlocks the full saving curve modeled at project initiation. At that threshold, the Design System moves from a governance project to an organizational capability embedded in how the company ships product, not a parallel process managed by the UX function.

HORIZON · 03

UX as Growth Infrastructure

The Design System is the foundation for a broader organizational claim: that UX is not a support function but a structural capability that determines the organization's capacity to grow and to operate efficiently at scale. The transition is complete when the system outlives the individuals who built it and accelerates the work of those who inherit it.

Supporting Evidence

Architecture,
governance & adoption.

The following materials are available on request. They have been redacted or abstracted here to protect confidential operational data.

Visual 01
4-Layer Architecture Diagram
Four-layer Design System architecture diagram showing token hierarchy, component library, organism patterns, and governance model
Visual 02
Adoption & Saving Curve
Squad adoption curve over time plotted against annualized efficiency saving projection across 15 squads and two brands
Visual 03
Governance & RACI Snapshot
RACI matrix and DS Committee governance structure with contribution flow and ownership model across design, engineering, and product
Next Case Study
My FIAT · Connected Vehicle Platform